
14th November 2025
Industry practice when running funds across multiple regions is to provide investors with information about how the fund is positioned by breaking down the exposure by region. For example: 50% in US equities, 10% in European equities etc. Sometimes, this exposure is then compared to a benchmark to give under- and over-weights. But is this actually a useful way to describe a fund’s exposure? This is especially true for fund of funds like our own, that make use of very active funds in our allocations.
This is best illustrated with an example. We invest across many UK equities funds. But, for many of these funds, their portfolios bear almost no relation to any market-cap-weighted UK index. The below table shows a correlation matrix of a selection of UK funds we use against the MSCI United Kingdom Index. Rockwood Strategic, a superbly performing investment trust investing at the smaller end of the UK market, has a correlation with the MSCI index of less than 0.5. Odyssean, another investment trust operating away from mainstream larger cap, is almost as uncorrelated. The coefficient of determination is the square of correlation and this number describes the proportion of the variance of one variable is explained by the another. So just 24% (0.492) of the variance of Rockwood Strategic’s unit price over the past 5 years (period chosen to match current manager tenure, source: FE fundinfo) can be explained by movements in the UK index. This is far lower than an ETF invested in European stocks (excluding the UK)!
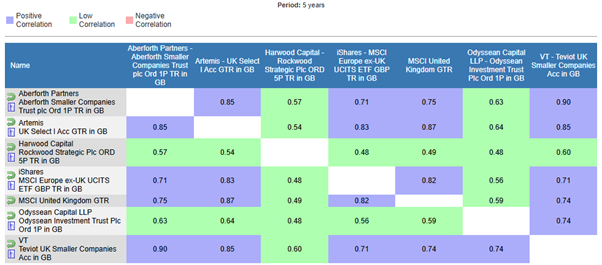
Source: FE fundinfo
Does putting Rockwood Strategic in the “UK equities” bucket really provide investors with a useful piece of information about our funds?
As we have often written about, we try to add value not just via asset allocation (for example, by accessing assets beyond ordinary liquid bonds and equities) but by working hard to identify talented managers who can generate strong risk adjusted returns. Correlation statistics can often be poor guides to the value a fund is adding. Often, the pool of securities they are fishing in is entirely incidental to their endeavours. Their portfolio may be made up of solely of Asian equities, but this portfolio bears little relation to the market-cap weighted index of the region – even if the correlation is high.
Take CIM Dividend Income: a portfolio of equities selected from the Asian region. Over 10 years, it is quite highly correlated with the MSCI Asia Pac Ex Japan index, and not very correlated with US equities, but eyeball the 10-year performance (source: FE fundinfo).
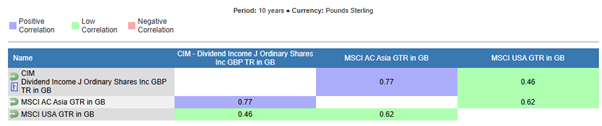
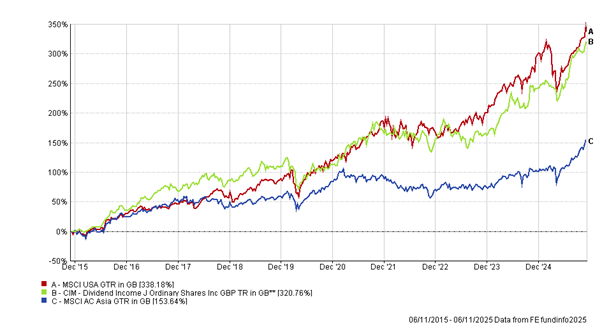
Source: FE fundinfo, 06/11/2015 to 06/11/2025
That kind of alpha means that it has delivered returns almost in line with US equities, leaving the index in its dust.
In short, the value proposition of multi-asset funds of funds (and indeed some model portfolio services) that use highly active managers is ill-served by industry convention. A layperson might just see a fund with high overall costs and with regional exposure not much different to a cheaper passively-constructed fund – with no understanding just how different the nature of the underlying exposure is – and how much value can be added.
The fact that highly active funds can offer very different exposure to an index is also reflected in another aspect of our investment process, where portfolio construction is driven by a granular consideration of each individual underlying fund’s valuation and return prospects as opposed to top-down regional considerations, a theme we will return to in a future blog.
How best to display the characteristics of funds (and models) like ours is a challenge we, as proponents of active fund management, must rise to. One idea put to us has been to display the active share of the underlying funds we access. Would this, alongside traditional asset allocation breakdowns, be enough to do justice to the value proposition funds of funds offer? We would welcome feedback on how fund of funds can improve disclosure to help investors understand what they own and how it is different.
Ben Conway – Head of Fund Management

For professional advisers only. This article is issued by Hawksmoor Fund Managers which is a trading name of Hawksmoor Investment Management (“Hawksmoor”). Hawksmoor is authorised and regulated by the Financial Conduct Authority. Hawksmoor’s registered office is 2nd Floor Stratus House, Emperor Way, Exeter Business Park, Exeter, Devon EX1 3QS. Company Number: 6307442. This document does not constitute an offer or invitation to any person, nor should its content be interpreted as investment or tax advice for which you should consult your financial adviser and/or accountant. The information and opinions it contains have been compiled or arrived at from sources believed to be reliable at the time and are given in good faith, but no representation is made as to their accuracy, completeness or correctness. Any opinion expressed in this document, whether in general or both on the performance of individual securities and in a wider economic context, represents the views of Hawksmoor at the time of preparation and may be subject to change. Past performance is not a guide to future performance. The value of an investment and any income from it can fall as well as rise as a result of market and currency fluctuations. You may not get back the amount you originally invested. FPC25578
Source: MSCI. Neither MSCI nor any other party involved in or related to compiling, computing or creating the MSCI data makes any express or implied warranties or representations with respect to such data (or the results to be obtained by the use thereof), and all such parties hereby expressly disclaim all warranties of originality, accuracy, completeness, merchantability or fitness for a particular purpose with respect to any of such data. Without limiting any of the foregoing, in no event shall MSCI, any of its affiliates or any third party involved in or related to compiling, computing or creating the data have any liability for any direct, indirect, special, punitive, consequential or any other damages (including lost profits) even if notified of the possibility of such damages. No further distribution or dissemination of the MSCI data is permitted without MSCI’s express written consent.