
April 2021
The current investment environment for active fund managers across a number of asset classes and regions is the best in years. We are excited about the performance that our three multi asset Fund of Funds could generate, given their exposure to high-conviction, benchmark-agnostic, pragmatically-managed and often style-agnostic active funds.
When analysing fund performance, we seldom look at cumulative numbers, especially over shorter time frames. Instead, we prefer to break down cumulative periods and look at performance during different discrete time frames. This provides a good feel for the typical environment in which a fund has historically performed well, and thus the likely environments in which a fund will do best in future. It also acts as a useful guide to assessing the alpha credentials (and the persistence of the alpha generation) of a manager. For example, if we look at an equity manager who has a value style. Since the 2007 financial crisis, the value style has significantly underperformed growth investing, however there have been times (typically short and sharp over the last 12 years), where conditions have been good for investing with a value style. We can isolate these periods and see how a fund manager has performed when they have a style tailwind and when they have a style headwind. Naturally, we would expect them to outperform the market when their style is in vogue. What is often more interesting and informative is how they perform when their style is out of favour, and they are wholly reliant on their stock picking abilities to try and keep up with the broader market. The holy grail is being able to identify a manager who outperforms when their style is in favour, but can perform close to, or as well as, the market when their style is not. Over the years we have managed to identify a number of these managers, which has been a big boost to our Funds’ performance.
Generally, over the long term, style headwinds and tailwinds are not that extreme, which allows manager alpha to shine through and overcome the periods when they are suffering from a style headwind. However, once every decade or so, market events lead to extreme style leadership which can swamp the alpha that a good active manager generates. We saw this during the dotcom bubble when the shares of many growth stocks, particularly ‘new paradigm’ tech stocks, went parabolic. In more recent years, in particular since the middle of 2018, we have seen another period where style leadership has become parabolic, with growth massively outperforming value and ‘concept’ stocks outperforming those with consistent (but theoretically less spectacular) earnings delivery. Market history has shown that these style leadership periods do not last forever, and when they unwind it often happens aggressively. Valuation eventually matters.
As market style leadership evolves over time, so too do the conditions that can help or hinder the potential for an active manager to outperform the market. There are many things that are in an active manager’s control that can help boost their chances of outperforming. These include maximizing their investment universe by capacity constraining their funds, and investing in quality resources and people that help analyse and understand their investable universe. However, there are also a number of things outside of their control linked to market dynamics and the wider investment environment.
In recent months, our interactions with active fund managers have filled us with increasing confidence that the market environment is the best in years for their chance of delivering outperformance. Market commentator John Authers studied, in a recent blog, US equity market leadership and found that in the past six months an equal-weighted benchmark of the largest US stocks has outperformed a market-cap weighted benchmark. This means that the majority of stocks are beating the index, boosting the chances that an active manager will outperform. Over the long term, equal-weighted benchmarks do tend to outperform, as smaller companies with strong growth prospects (which are small components of market cap weighted benchmarks) do well, and the large companies with lower growth prospects lag. In recent years, this trend has been flipped on its head thanks to the strong performance of large-cap technology companies, which have achieved strong growth rates combined with significant valuation multiple expansion – despite already being huge companies. A persistent reversal in this trend would be very welcome for active managers.
Correlation between stocks has also been falling, another good dynamic for active managers. The less correlated stocks are, the higher the chance of achieving differentiated performance. Alongside low stock correlations, active managers also like high dispersion – that is, stock returns varying a lot from each other. Greater dispersion means you are rewarded more handsomely for good investments (and punished more for bad ones!). Price dispersion has been low over the past 5 years, but has been rising meaningfully in recent months, which has boosted active managers’ chances of outperforming.
The other aspect of dispersion, and one we are particularly interested in due to our aim of investing in portfolios that offer us a margin of safety, is valuation dispersion. The greater the valuation dispersion in a market, the bigger the opportunity set for managers to build attractively valued portfolios – even if index level valuations are expensive. With valuation dispersion currently elevated, we are finding great opportunities to invest in portfolios that are cheap both in absolute terms and relative to their own history, even though index level valuations are unattractive. One example of this is our investment in River & Mercantile European, an equity fund managed by James Sym. The below chart, sourced from Absolute Strategy Research, shows that in aggregate European equities are not cheap relative to their own history.
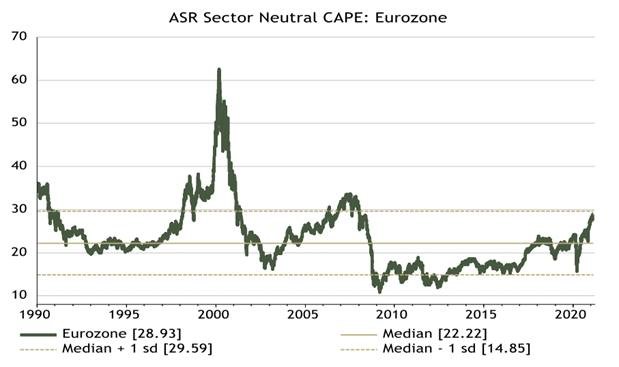
Source: Absolute Strategy Research, 18/02/2021.
However, our research into James Sym’s fund has highlighted that both inter-sector dispersion (comparing one sector with another) and intra-sector dispersion (comparing the stocks that make up a sector) are now high relative to history, as shown in the charts below. Stock correlations in Europe have also declined materially and price dispersion has been rising in the region too. He is incredibly excited for his absolute and relative return prospects in this environment.
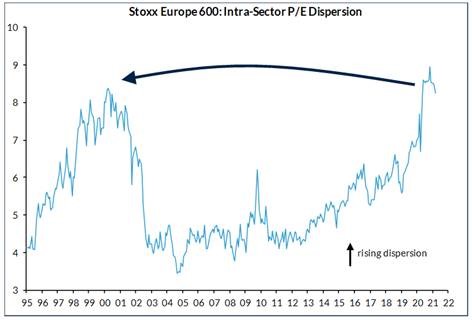
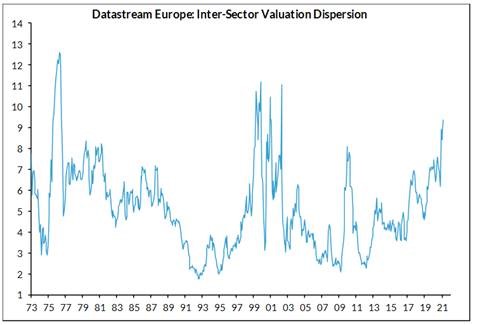
Source: Kepler Cheuvreux, 12/03/2021.
We have heard the same story from UK and Asian equity managers, and from credit managers. The foundations for active outperformance are well and truly in place which stands our Funds in good stead.
Returning to performance analysis, using discrete ‘scenario’ periods is far more useful for our own portfolio construction than looking at cumulative numbers which can be skewed in the short term by extreme market conditions. As you’ll be aware, we never want to skew our portfolios to the extent that our absolute returns are dependent on a binary event or macro scenario playing out. We therefore want to hold positions that will perform well at different times and in different market environments, offering a host of differentiated and uncorrelated return drivers. When blended together, offer the potential to, and subsequently, deliver strong absolute returns. The below table shows how the Vanbrugh Fund has performed relative to its sector (IA Mixed Investment 20-60% Shares), UK equities and global bonds during some discrete market periods.
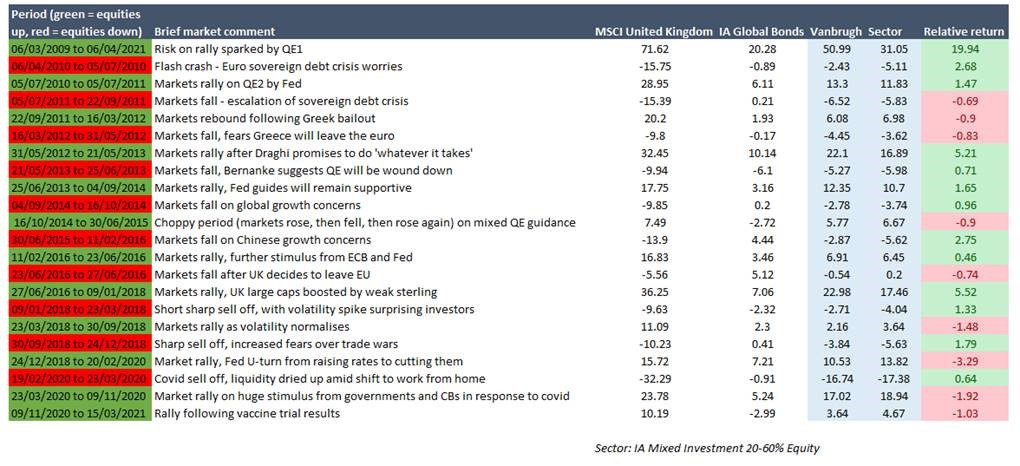
Source: FE Analytics. See MSCI disclaimer.
As you will be aware, we are valuation conscious investors. We are searching for investments that are cheap relative to their fundamental prospects, and thus offer a margin of safety (limited downside, with good upside). Over the long term, the above table shows that our investment approach has served us well with the Vanbrugh Fund materially outperforming its sector since launch, and also outperforming in the majority of the discrete periods highlighted above. Typically, when underperformance has occurred, it hasn’t been material (less than 1% in any period). Unfortunately, in more recent times the relative underperformance has been greater. This is not a result of us doing anything differently. Instead it is a function of the extreme market conditions that have been less conducive to active managers, who focus on building inexpensive portfolios, being able to deliver meaningful outperformance.
We have continued to identify investments offering a margin of safety and good long term prospects, which have performed well in absolute terms, but have lagged market performance dominated by expensive technology stocks. We are cheered to see the early signs of market leadership normalizing, the conditions for active management improving, and valuations mattering again. These are conditions that should see our strong absolute returns continue, and our relative performance take care of itself.
Dan Cartridge – Assistant Fund Manager

This financial promotion is issued by Hawksmoor Fund Managers which is a trading name of Hawksmoor Investment Management (“Hawksmoor”). Hawksmoor is authorised and regulated by the Financial Conduct Authority. Hawksmoor’s registered office is 2nd Floor Stratus House, Emperor Way, Exeter Business Park, Exeter, Devon EX1 3QS. Company Number: 6307442. This document does not constitute an offer or invitation to any person, nor should its content be interpreted as investment or tax advice for which you should consult your financial adviser and/or accountant. The information and opinions it contains have been compiled or arrived at from sources believed to be reliable at the time and are given in good faith, but no representation is made as to their accuracy, completeness or correctness. Any opinion expressed in this document, whether in general or both on the performance of individual securities and in a wider economic context, represents the views of Hawksmoor at the time of preparation and may be subject to change. Past performance is not a guide to future performance. The value of an investment and any income from it can fall as well as rise as a result of market and currency fluctuations. You may not get back the amount you originally invested. HA4262.
Source: MSCI. Neither MSCI nor any other party involved in or related to compiling, computing or creating the MSCI data makes any express or implied warranties or representations with respect to such data (or the results to be obtained by the use thereof), and all such parties hereby expressly disclaim all warranties of originality, accuracy, completeness, merchantability or fitness for a particular purpose with respect to any of such data. Without limiting any of the foregoing, in no event shall MSCI, any of its affiliates or any third party involved in or related to compiling, computing or creating the data have any liability for any direct, indirect, special, punitive, consequential or any other damages (including lost profits) even if notified of the possibility of such damages. No further distribution or dissemination of the MSCI data is permitted without MSCI’s express written consent.