
September 2022
In January 2021 we wrote “Time for a Different Approach?” and in which we questioned the merits of a traditional 60% equity 40% bond (60/40) portfolio given how expensive prevailing valuations of both sides of the equation were. Having just witnessed the worst start to a year for mainstream equities and bonds for decades, it is right to revisit the article and ask the question:
Is it still time for a different approach?
Spoiler alert: yes, it is!
2022 performance so far
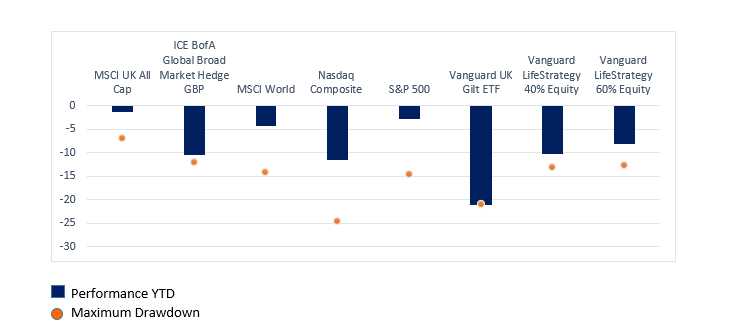
Source: FE Fundinfo Total Return in GBP 31/12/21 to 31/08/22.
During the first half of 2022, there have been some remarkable moves in financial markets that have taken many investors and commentators by surprise. Mainstream equity and bond markets have simultaneously suffered the worst start to a year in decades. It is impossible to predict moves like this in advance, however bond yields started the year at such low levels (close to zero for government bonds) that they offered little margin of safety (from falling capital values) if anything other than a continued benign environment preventing higher yields transpired. Rampant inflation, caused in some part by the awful ongoing war in Ukraine, has prompted central banks, notably in the UK and US to aggressively raise rates from their record low levels in order to tame inflation even at the risk of driving economies into recession. Higher bond yeilds have helped drive a dramatic repricing of assets – particularly those regarded as ‘growth’ equities such as technology companies. The latter’s success of recent years has resulted in them becoming large components of equity indices. The Information Technology sector made up around 13% of the MSCI World Index back in 2014 but as at December 2021 represented as much as 24%. As a result, any weakness in that sector has a disproportionate effect on global equity markets.
As bond yields have risen from negligible levels last year, the price has fallen (yields and prices move inversely to each other) causing capital losses for investors. In our original article we suggested that such low starting yields would diminish bonds’ efficacy as a hedge to equity risk and that has certainly played out this year with both asset classes losing money in tandem. For equities and bonds to fall together is at odds with recent decades when bonds typically behaved in an uncorrelated way to equities, acting as a good diversifier within portfolios. That is why this year’s negative performance from a simple traditional equity/bond portfolio has wrong-footed so many people whose strategy relied on that past relationship continuing into the future.
Government bonds – yields backed up from low levels but still offer negative real yields
Government bond yields have fallen steadily over the past 40 years to such an extent that, at the trough last year, investors in 10-year UK government debt, were being paid a paltry nominal gross redemption yield of 0.25%. That yield was only sustainable in the event of a continued era of low inflation, or even deflation and accommodative central banks keeping interest rates low, but even then, would have failed to satisfy the minimum objective of any investor: achieving positive returns after inflation and costs.
The subsequent back up in yields to 3.3% in the US, 2.9% in the UK, and 1.6% in the Eurozone (Source FT.com as at 01/09/22), has caused sharp capital losses for investors, particularly those invested in the longest dated bonds where losses exceed 40% this year in some cases. Yet our industry continues to regard government bonds as low risk, forming the foundation of most cautious portfolios. Furthermore, these higher nominal yields are still below the prevailing rate of inflation thus offering negative real yields for investors.
Equity markets – are they cheap enough yet?
The caution we exercised last year on the outlook for mainstream equity markets was, like bonds, based on prevailing valuations being at such extreme levels that future returns were likely to disappoint. We know that valuations are not a good short term timing tool, proven by US equities remaining ‘expensive’ for many years before they corrected lower this year, but valuations have historically been excellent predictors of future returns over the long term. Yes, most equity markets have sold off this year, but many markets remain expensive relative to history, with this ebing particularly true of the US. Indeed, the US fund management group, GMO, using the past 125 years of historic data as a guide and based on todays prevailing valuations, forecast US large cap equities to fall on average by 2.2% in real terms each year over the next 7 years. As US large caps represent around 70% of global equity indices, this has implications for the likely returns from the equity component of 60/40 portfolios.
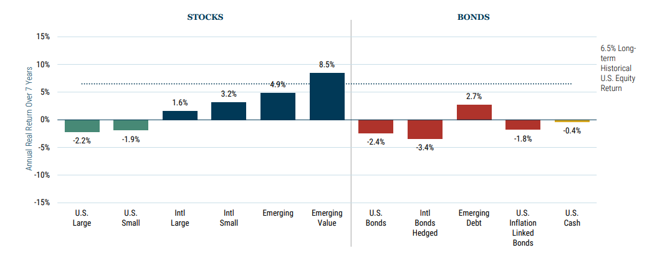
Source: GMO 31/07/2022.
Putting the negative real returns of government bonds together with the increased likelihood of low or perhaps negative prospective returns from US equities, it seems unlikely that a traditional benchmark-oriented global equity, global bond portfolio can meet the basic client objectives of inflation-beating returns.
There is (still) another way
There is a world beyond mainstream equities and bonds with a number of asset classes that we loosely bring together as ‘alternative assets.’ As highlighted in our previous note, they include investments like property, alternative credit, private equity, shipping, and infrastructure. These are all accessed via investment trusts whose fixed capital structure make them perfect for owning these less liquid underlying assets. Some of these have low to negative correlations with other financial assets and so bring diversification benefits to a multi-asset portfolio, whilst many are also generous, and often inflation-linked, income generators which help address the problem posed by low bond yields. Other sub-asset classes such as music royalties, battery storage and life science debt capital, whose risk and return drivers are almost entirely independent of the economic cycle and financial markets, are available to those willing to look beyond the mainstream.
These investment trusts have performed well in absolute and relative terms over the past year, proving our assertion last year that they could act as a complementary allocation to those pure equity/bond portfolios.
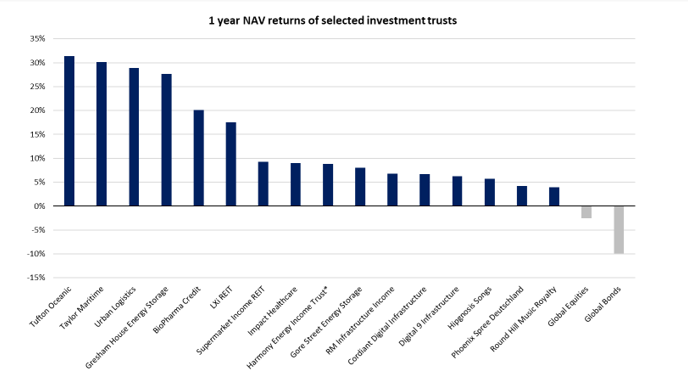
Source: FE Fundinfo and internal 30/06/2021 to 30/06/2022 *from 21/02/2022.
Active management
As we are valuation-led investors allocating our clients’ money away from expensive assets and towards cheap assets, it follows that we don’t adhere to static asset allocation parameters. We don’t believe assets are permanently low or high risk and will allocate to those which carry the best chance of making positive real returns for our investors over the long term. Looking beyond the mainstream is essential when these assets are expensive and is what we think sets us apart from more traditional multi-asset investors. The chart below shows the Vanbrugh Fund’s historic asset allocation ranges (blue bars) over the course of its 13-year life since launch in February 2009, and its current allocation (red diamond). This shows that we haven’t always been lowly weighted towards mainstream assets like equities and corporate bonds. The allocations will always be determined by prevailing valuations.
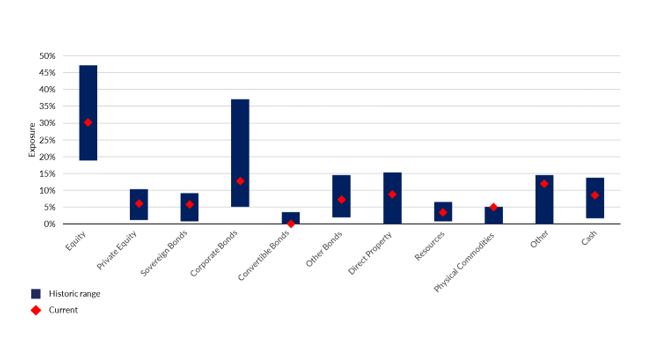
Source: Internal, Vanbrugh Fund, 31/03/2009 to 31/12/2022.
An unconstrained approach to asset allocation and a willingness to zero weight very expensive markets, regardless of how big they might be, will also be important. The corollary of this is an adoption of a more targeted approach across public markets in identifying opportunities! Areas such as UK small caps, Japanese small caps, Asian equity income and Pan European High Yield bonds have cheapened in recent months and we are adding. As these assets are under-represented in passive and other benchmark orientated multi-asset approaches, our funds still provide diversification benefits even if our alternative assets are not as dominant as earlier in the year.
Finding value is not always about identifying it at the headline asset or sub-asset level. Just because the aggregate valuation of mainstream equities and bonds is expensive does not mean cheap valuation opportunities cannot be found within them. A key measure of the likelihood of finding such value is the valuation dispersion exhibited within asset classes. When this dispersion is high, it implies cheap portfolios, with little-or-no sector or style bias, can be constructed even as aggregate (or index) valuations are expensive. We are able to identify active funds managed by very talented managers whose portfolio valuations metrics are close to all-time historic lows – even as the headline valuation of their universe is close to all-time highs! Passive portfolios or active portfolios that are large and necessarily have to own large components of the benchmark cannot possibly take advantage of the excellent opportunities that result from elevated valuation dispersion.
The Hawksmoor Funds: truly multi-asset
The chart below compares the Hawksmoor Distribution Fund’s asset allocation with that of a market-cap weighted 60/40 portfolio, starkly illustrating the highly diversified nature of the former and the concentrated exposure of the latter. In a world of elevated asset prices, having access to a fuller set of investments not only increases our opportunity set when scouring the globe for attractive opportunities, but just as importantly helps dampen portfolio volatility, effectively replacing the once effective hedging capabilities of government bonds. As multi-asset fund managers, carefully combining different holdings and focusing on inter-holding correlations is as central to what we do as identifying attractively valued individual investments.
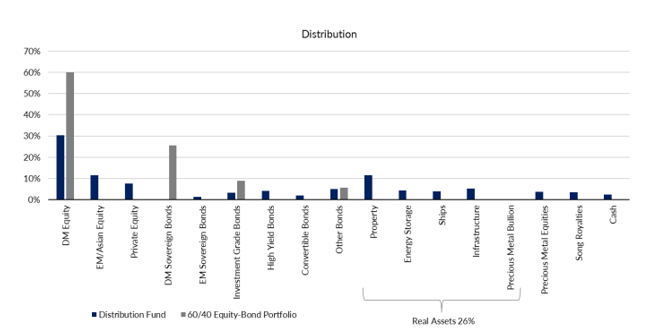
Source: Internal, MSCI and ICE, 30/07/2022. Portfolio of 60% equities represented by MSCI World All Cap, 40% bonds represented by ICE BofA Global Broad Market Hedge GBP. See full disclaimers at end of article.
Our award winning, highly diversified multi-asset fund range can be used as standalone portfolios for clients. In addition, with their current low allocations to mainstream equity and bond markets and significant exposure to alternative assets and more niche areas within public markets, they can also act as an excellent complement to other active and passive multi-asset funds that invest using a more traditional framework.
Similarly, while we strongly believe that the combination of our differentiated investment process and our current portfolio positioning is the best way to protect and grow our client’s wealth in the years ahead, we recognize that humility in investing is important and that we risk being temporarily wrong. Perhaps equity markets will continue to defy gravity and maybe government bond yields will continue to head lower, in which case the trusty 60% equity 40% bond portfolio might have life in it yet. In which case, blending our funds, together with a more passive and statically allocated solution offers the prospect of better risk adjusted returns. We can point to that being the case over the life of the Vanbrugh fund where, as the chart below shows, any additional allocation to Vanbrugh taken from a pure 40/60 passive portfolio (the equivalent risk-rated passive solution) has delivered better performance with lower volatility. We are excited at the prospect of maintaining that pattern of performance over the next 13 years.
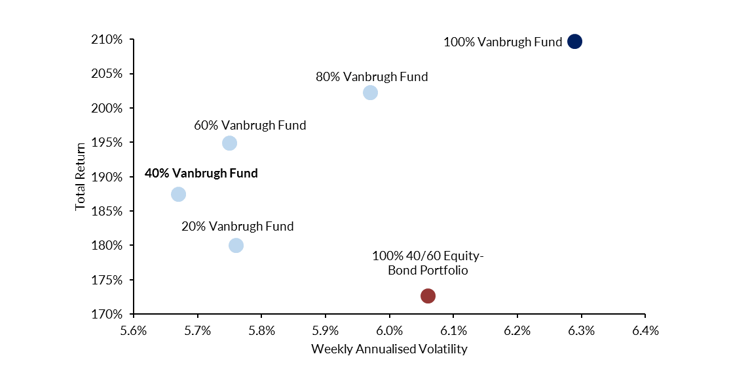
Source. FE fundinfo, 18/02/2009 to 31/12/2022. 40% equities represented by MSCI World All Cap, 60% bonds represented by ICE BofA Global Broad Market Hedge GBP. 85 See full disclaimers at end of article.
Daniel Lockyer– Senior Fund Manager

This article is issued by Hawksmoor Fund Managers which is a trading name of Hawksmoor Investment Management (“Hawksmoor”). Hawksmoor is authorised and regulated by the Financial Conduct Authority. Hawksmoor’s registered office is 2nd Floor Stratus House, Emperor Way, Exeter Business Park, Exeter, Devon EX1 3QS. Company Number: 6307442. This document does not constitute an offer or invitation to any person, nor should its content be interpreted as investment or tax advice for which you should consult your financial adviser and/or accountant. The information and opinions it contains have been compiled or arrived at from sources believed to be reliable at the time and are given in good faith, but no representation is made as to their accuracy, completeness or correctness. Any opinion expressed in this document, whether in general or both on the performance of individual securities and in a wider economic context, represents the views of Hawksmoor at the time of preparation and may be subject to change. Past performance is not a guide to future performance. The value of an investment and any income from it can fall as well as rise as a result of market and currency fluctuations. You may not get back the amount you originally invested. FPC545.
Source: MSCI. Neither MSCI nor any other party involved in or related to compiling, computing or creating the MSCI data makes any express or implied warranties or representations with respect to such data (or the results to be obtained by the use thereof), and all such parties hereby expressly disclaim all warranties of originality, accuracy, completeness, merchantability or fitness for a particular purpose with respect to any of such data. Without limiting any of the foregoing, in no event shall MSCI, any of its affiliates or any third party involved in or related to compiling, computing, or creating the data have any liability for any direct, indirect, special, punitive, consequential or any other damages (including lost profits) even if notified of the possibility of such damages. No further distribution or dissemination of the MSCI data is permitted without MSCI’s express written consent.
The index data referenced herein is the property of ICE Data Indices, LLC, its affiliates (“ICE Data”) and/or its Third-Party Suppliers and has been licensed for use by Hawksmoor Investment Management.ICE Data and its Third-Party Suppliers accept no liability in connection with its use. See https://www.hawksmoorim.co.uk/ice-data-indices-disclaimer/ for a full copy of the Disclaimer.